|
[The page documents the legacy trace utility - which was removed in FreeRTOS V7.1.0 - users may find the newer
Trace Hook Macros easier and more powerful to use.]
The trace visualisation utility allows the RTOS activity to be examined.
It records the sequence in which tasks are given microcontroller processing time.
To use the utility the macro configUSE_TRACE_FACILITY must be defined as 1 within FreeRTOSConfig.h when the application is compiled. See the configuration section in the RTOS API documentation for more information.
The trace is started by calling vTaskStartTrace() and ended by calling ulTaskEndTrace(). It will end automatically if its buffer becomes full.
The completed trace buffer can be stored to disk for offline examination. The DOS/Windows utility tracecon.exe converts the stored buffer to a tab delimited text file. This can then be opened and examined in a spread sheet application.
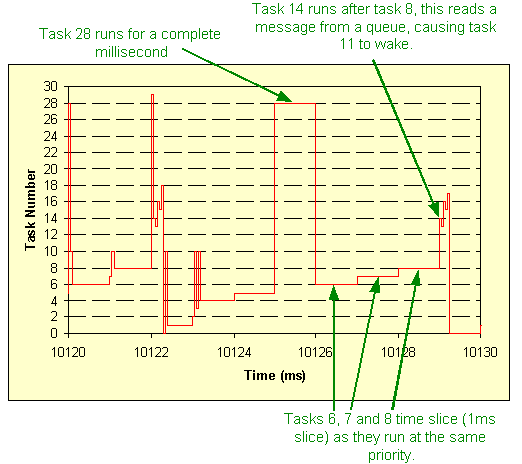
Below is a 10 millisecond example output collected from the AMD 186 demo application. The x axis shows the passing of time, and the y axis the number of the task that is running.
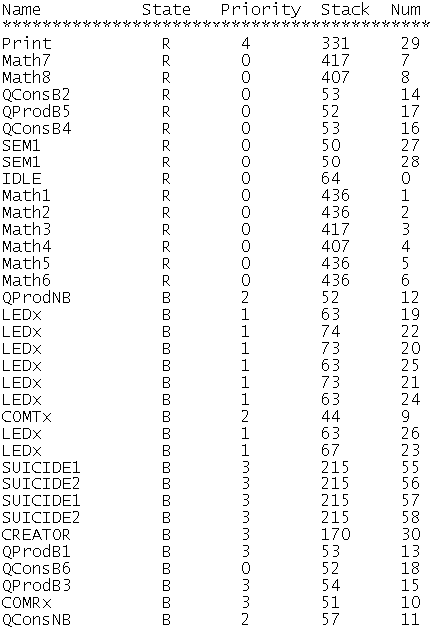
Each task is automatically allocated a number when it is created. vTaskList() can be used to obtain the number allocated to each task, along with some other useful information. The information returned by vTaskList() during the demo application is shown below, where:
- Name - is the name given to the task when it was created. Note that the demo application
creates more than one instance of some tasks.
- State - shows the state of a task. This can be either 'B'locked, 'R'eady, 'S'uspended or 'D'eleted.
- Priority - is the priority given to the task when it was created.
- Stack - shows the high water mark of the task stack. This is the minimum amount of free stack
that has been available during the lifetime of the task.
- Num - is the number automatically allocated to the task.
In this example, it can be seen that tasks 6, 7, 8 and 14 are all running at priority 0. They therefore time slice between themselves and the other priority 0 tasks (including the idle task). Task 14 reads a message from a queue (see BlockQ.c in the demo application). This frees a space on the queue. Task 13 was blocked waiting for a space to be available, so now wakes, posts a message then blocks again.
Note: In its current implementation, the time resolution of the trace is equal to the tick rate. Context switches can occur more frequently than the system tick (if a task blocks for example). When this occurs the trace will show that a context switch has occurred and will accurately shows the context switch sequencing. However, the timing of context switches that occur between system ticks cannot accurately be recorded. The ports could easily be modified to provide a higher resolution time stamp by making use of a free running timer.
Copyright (C) Amazon Web Services, Inc. or its affiliates. All rights reserved.
|


